How to create an animated graph
ACTIONS & ANIMATIONS
Adding Links
Adding Anchor Points
Hover Effects
Pop ups
Fade-In Effects
Parallax Scrolling
Animated Graphs
Animated Timelines
Gated Content
< BACK TO OVERVIEW
Learn how to animate different types of graphs using Readz:


The following step-by-step instructions will show you how to animate a bar chart. At the end of the tutorial, you will find tips to adapt the same method to other types of graphs.


PART 1: PREPARE THE ASSETS IN ADOBE ILLUSTRATOR
- Open the PDF file containing your graph in Illustrator
- Create an artboard that contains the graph
- Make the background under the X axis white.
- Hide the layers that contain the bars.
- Export the artboard as an SVG (in the SVG export settings, convert the text to outlines). Name it “Graph 1”.
- Back in the artboard, hide the text and lines and show only the bars.
- Export as an SVG. Name it “Graph 2”.
PART 2: UPLOAD TO READZ AND ANIMATE
- In the Readz editor, create a transparent box. Name it "Graph container"
- Drag an image element (your "Graph 1" SVG) into the box.
- In the Layout panel, make it the same width as the box and set it's position to Y=0, X=0, Z=1
- Repeat the previous step in mobile view.
- In desktop view, copy and paste the image. Use the Index to make sure it is also contained inside the "Graph container" box.
- Double click on the copied image and replace it with your "Graph 2" SVG
- Select "Graph 2" and open the Layout panel. Change its Z value to 0 so that it is behind "Graph 1" and make its Y position 0.
- Repeat the last step in mobile view.
We are finally ready to add the animation.
- Select "Graph container" and open the Element Actions panel, Jedi tab. Add an On Element Display action to Fade in Nudge Up. Set "Graph 1" as the Target Element. Click on "Hide Target Element" so that the element is hidden until the action displays it.
- Add another
On Element Display
action to "Graph container". This time, the animation is Expand Up
and the Target Element
"Graph 2". Click on "Hide Target Element".Your animated graph is ready to use!
EXPLORE OTHER POSSIBILITIES
Following the same procedure you can come up with countless variations to make your data displays come to life. Here are some ideas:
For this circle graph, we use three square images that are displayed with a
Rotate In
animation. Each of the three images is on a different Z level (0, 1 and 2) so that they can overlap.0%
For this graph, we use one square image (on level Z=0) and a textbox (on level Z=1). Both elements are inside a container box. The box has two On Element Display animations: a Rotate In animation to display the image and a Fade In animation to display the textbox.
To create the counter effect, type 0% in the textbox. Paint over the 0 and open the Sub-Element Actions panel. Add an On Element Display Count action. Type the number you wish to get to in the End field. Choose the number of steps and time per step. Set a 2 second delay so that the counter begins after the other animations are completed. Set this action to be performed Once Per Session.
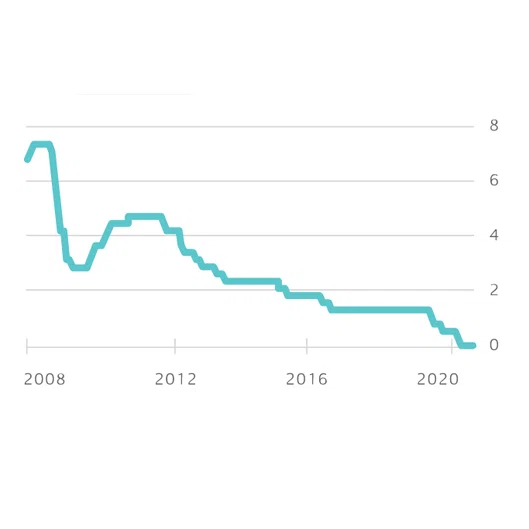
This graph has the same structure as the bar graph, but the plot line is displayed with a
Fade in Nudge
Up animation.Contact Support
STAY IN THE LOOP
Sign up for product updates