Analytics Dashboard
SOCIAL, SEO & ANALYTICS
On-Page SEO
Create 301 Redirects
Connect Google Analytics
Readz Analytics Dashboard
Conversions Step-by-step
Set up Facebook sharing
< BACK TO OVERVIEW
What are "traffic analytics?"
Traffic analytics are a series of data designed to help you better understand how your customers are engaging with your digital publications and microsites.
By learning your customers’ reading habits, you can optimize your call to actions to drive engagement and improve conversion metrics.
Starting out
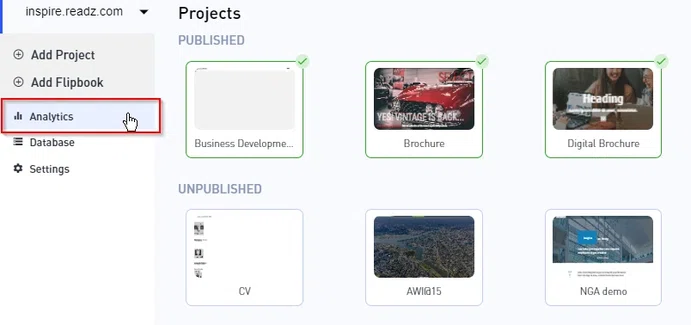
To access traffic analytics from your Dashboard, click the “Analytics” link on the left side menu, then select the “Traffic” tab. You can view analytics for different projects by selecting one from the “URL” drop down list.

What is a “session?”
A visit to your project from a single device and within a certain timeframe will count as one session. If a person goes to your Readz project on their phone, you’ll get one session in analytics. If that person takes less than a 30-minute break, then continues reading, it will still only count as one session. Any activity beyond an idle time of 30-minutes will count as a second session. The main difference between Readz Analytics and Google Analytics is that Google Analytics does not count record a session if the page is viewed for less than 60 seconds. Readz records a session as soon as a page gets a unique view.
Sessions and dwell time graphs
The first graphs you see when viewing a traffic analytics page are the Session and Dwell Time graphs at the top. The Sessions graph is a visual overview of the number of visits to your page at a given time of day. The dwell time is another measurement you can see in Readz Analytics. Dwell time is a metric used to measure the duration of user-engagement, ending when the last interaction on the page (scroll, click, etc.) occurs. You can click a spot on either graph to highlight how many sessions you had during that particular time of day. You can change the time frame these charts display by selecting week, month, year or lifetime just above the charts. Changing the time affects all data on the page, not just the Sessions and Dwell Time charts.
Sessions chart
The Sessions chart provides you with specific information about how sessions view individual pages. The chart shows the number of views, number of entrances, duration of sessions and number of shares for a given page.
Other data
View - A visit to your page.
Sessions - A visit to your project from a single device and within a certain timeframe will count as one session. If a person goes to your Readz project on their phone, you’ll get one session in analytics. If that person takes less than a 30-minute break, then continues reading, it will still only count as one session. Any activity beyond an idle time of 30-minutes will count as a second session. The main difference between Readz Analytics and Google Analytics is that Google Analytics does not count record a session if the page is viewed for less than 60 seconds. Readz records a session as soon as a page gets a unique view.
Entrances - Entrances shows the number of sessions in which this particular page was the first one opened to enter the project. Or in other words the metric “Entrances” tells you how many times this particular page was the first time in a session versus the overall total number of sessions.
Dwell time
Direct traffic - Metrics used to measure the duration of user-engagement, ending when the user leaves the tab that has the URL. Dwell time is calculated from the moment a page is viewed until the last interactive (a click, a scroll, etc.) Shares - How many times a page was shared to social media (Facebook, Twitter, LinkedIn, etc.) Devices - The percentage of your visitors who used either a desktop, tablet, or a phone to view your project. Geolocation - Country your visitors accessed your project from. If you see N/A, this means those visitors had their browser’s location tracking turned off. Traffic Sources
Direct traffic - Metrics used to measure the duration of user-engagement, ending when the user leaves the tab that has the URL. Dwell time is calculated from the moment a page is viewed until the last interactive (a click, a scroll, etc.) Shares - How many times a page was shared to social media (Facebook, Twitter, LinkedIn, etc.) Devices - The percentage of your visitors who used either a desktop, tablet, or a phone to view your project. Geolocation - Country your visitors accessed your project from. If you see N/A, this means those visitors had their browser’s location tracking turned off. Traffic Sources
is defined as visits that arrived on your site or project either by typing the URL into a browser or through bookmarks or links.
In addition, if we can’t recognize the traffic source of a visit, it will also be categorized as Direct in your Analytics report.
Below are some instances when we can’t identify the source of your traffic:
- Depending on your email marketing tool, traffic from your email marketing campaigns is often categorized as Direct.
- Traffic from any offline documents, like PDF, MS Word, etc.
- Traffic from mobile social media apps.
- Traffic from QR codes
- Depending on browser issues, sometimes traffic from organic search is also categorized as Direct.
Download your data
Click on the cloud icon on the top right of the sessions chart to download the data in CSV format, or click on the cloud icon at the top right of the referrers chart to download its data.
If you'd like to learn more about how to get the most out of your conversions, click here.
Contact Support
STAY IN THE LOOP
Sign up for product updates
