How To Check Your (Developer) Console
How To Check Your (Developer) Console
TROUBLESHOOTING
Checking Your Browser Console
< BACK TO OVERVIEW
Native web apps like Readz can sometimes be tricky to troubleshoot, especially with the number of browsers and the growing number of plugins available. Often an issue will occur only on your platform (and/or your colleagues who will have a similar setup).
Luckily, all browsers offer features to help check what is happening. This will help us enormously, and we might sometimes ask you to provide us with this console information during troubleshooting.
Google Chrome
To open the Console in Google Chrome:
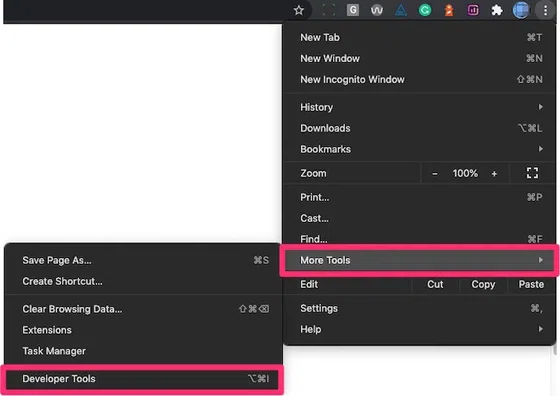
Open the Chrome Menu in the upper-right corner of your Chrome browser window
Select 'More Tools' and in the additional menu select 'Developer Tools'
The Developer Console will open up
Alternatively, you can also use the shortcut Shift + CTRL +J on Windows and Option + ⌘ + J on macOS.

Developer Console
In the developer tools, on the top, select 'Console'.
With the Console open, try to repeat the action that failed or caused an issue. Possibly you will see error messages appearing in the Console.
You can either send us a screenshot from the messages you see in the Console or send us the log. You can create a log by right-clicking in the Console and then selecting 'Save As...'.
Orange guides
It's also important to ensure that your elements are lined up with other elements. From a design perspective, we want to make our pages look as polished as possible, and alignment and consistent margins help a lot with achieving that polished look. The image above shows an example of what our guide-lines look like when you align elements.
Contact Support
STAY IN THE LOOP
Sign up for product updates
